Our team investigating Skin and Bone: the Shadowy Trade in Human Body Parts looked at hundreds of companies related to the business of recycling dead humans. We read through thousands of court documents, regulatory reports, corporate records and internal company memos. (Read more about the specific datasets we queried in our methodology here).
We analyzed data on imports, inspections, adverse events, and accident reports filed with the Food and Drug Administration, the US agency that oversees the human tissue trade.
Organizing files
Everyone has her own way of keeping track of information. Organization is particularly difficult and critical during long projects when a reporter compiles libraries of documents. During our eight-month investigation, I read through more than 1,000 documents and interviews. Here is how I keep track of our findings:
- Electronic copies: Paper is impossible to search. It’s clumsy and heavy to haul around. So I save everything as a PDF. When I receive paper documents from a source or from a records request, I immediately scan them in and save them on my desktop.
- Adobe Acrobat Pro: After I have a PDF, my first step is to run optical character recognition. This can take a while for large documents, spurring fresh pots of tea, impromptu yoga poses, and office chatter. Having searchable text saves time in the long-run and makes my next step easier. I read through each document, creating bookmarks and highlighting important information. This way my colleagues can simply scan the file for the best bits.
- Excel: I’m not done yet. Now comes the most crucial step. Imagine reading a document in December, but waiting until June to write the story. Would you remember all the content that document contains? I don’t. Before moving that PDF from my desktop to its proper place in my project folder, I go back through the document one more time, logging important information into a spreadsheet. Each fact or quote is given a subject tag. That way when I’m writing about a specific topic, I can “Sort” or “Filter” on that topic. I also include the source and the file name. That’s important so I can access that file quickly when I write, and when I insert footnotes for our fact checking staff and lawyers.
Identifying relationships
For a more systematic look at the industry, I compiled data on imports, inspections, adverse events, and accident reports filed with the FDA. It’s impossible to identify the relationships between so many companies, individuals and events. I was sure we’d miss part of the story without being able to keep track somehow.
David Donald, data editor at our parent Center for Public Integrity, guided my requests for data and trained me on the spot on how to clean and analyze the data in Excel and SQL Server.
I started building simple “social networks” using a free Excel plugin called NodeXL. But the process was time-consuming and its benefits limited for my needs. And I’m not proficient with the software to begin with.
I had to manually enter each name – making sure that if a name showed up twice, they were exactly uniform so the software wouldn’t interpret those as unique entities. I created a separate field and manually entered source data to keep track of how I learned of a specific connection.
And I couldn’t enter events such as inspections, imports or criminal investigations. So when my editor told me we would get help from a powerful software giant called Palantir, I was thrilled. It’s like NodeXL on steroids.

Palantir was started by computer scientists from Stanford and the cofounder of PayPal. They developed software to analyze big data sets and social networks. It has since grown into a multi-billion dollar enterprise that contracts with Fortune 500 companies and governments around the world.
Palantir launched a philanthropic engineering team to donate its software to nonprofits like ours, which could never afford it otherwise.
““We view our mission of making the world a better place as core to who we are as a company. We use our software to further this mission in many areas including philanthropy,” said Alexander Karp, Palantir co-founder and CEO.
It has helped ICIJ map out the network behind the murder of Wall Street Journalist Daniel Pearl. It also worked with our parent Center for Public Integrity to analyze 5 million mortgage applications for a project about subprime lenders.

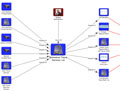
I spent long days at Palantir’s offices outside D.C., uploading and tagging documents with the help of its analysts at Praescient Analytics. Working together, we started building out known networks and uncovering new ones – like the connection between RTI, its non-profit recovery outfit, and their suppliers.

We uploaded more than 1 million companies, individuals and events (such as imports, seizures and recalls) into Palantir to build out a network previously buried in data sets and documents. The result was a rich and dense dataset that made it easy to grab a comprehensive picture of any entity in just a few key strokes.
It therefore becomes a powerful reporting tool, rather than merely a way to visualize networks.
To check out the result of the network visualizations, watch this video: