ICIJ’s technology team has unrolled new additions to Datashare, the organization’s foundational research platform that allows journalists and others to analyze mass data leaks.
The game-changing software, which has been downloaded more than 20,000 times over the last four years, can process millions of documents in several languages, detecting and extracting key information more efficiently than previously possible.
The integration of Neo4j, a graph database management system, into Datashare boosts the software’s capabilities, allowing journalists to quickly extrapolate information from documents into graphs that connect the dots between people and corporate entities.
“It’s basically enabling journalists to do complex research,” Michael Hunger, a software developer at Neo4j, said. “Think about it like a detective who gets just a pile of paper — and suddenly all the files are on the investigative dashboard with all the strings connected.”
The technology shows how journalism is adapting to the times, rather than being left behind, Hunger said.
“It’s really great to see that these tools are not just used in traditional capitalist industries to make rich people richer,” Hunger said.
Neo4j has partnered with ICIJ in the past: Its technology played a vital role in projects like the Panama Papers and Offshore Leaks.
ICIJ’s free Offshore Leak Database, for example, is built with Neo4j and links hundreds of thousands of offshore companies to their ultimate beneficial owners. The database is populated with entities found in ICIJ’s past investigations including the Pandora Papers, Panama Papers, Luanda Leaks and Paradise Papers.
Machine learning engineer Clément Doumouro, who joined ICIJ after a 10-month Neo4j fellowship, spearheaded the integration of the graph database tool into Datashare.
In past projects, the creation of a graph database took multiple steps, and required manually exporting data from Datashare to build a Neo4j database externally. The new Neo4j plug-in streamlines this process by automating the generation of a graph database, powered by named entities — people, organizations and places — uncovered in the documents indexed by Datashare.
“With the new plug-in released, doors open for more Neo4j-based features inside Datashare, which will allow us and other Datashare users to rely even more on Neo4j for future investigations,” Doumouro said.
A deep-dive and demo for data journalists
The data in graphs created with the plug-in differs slightly from data in corporate registries like ICIJ’s Offshore Leak Database.
To create the Offshore Leak Database, links between corporate entities were carefully reviewed and fact checked by ICIJ’s data team to ensure accuracy. Such graphs are usually built during the final stages of investigations and cannot be created by automatically extracting entities found inside Datashare.
Graphs created with the new plug-in are noisier but they represent a precious pool of information. By using the appropriate tools to analyze and explore this new source of information, journalists can speed up their data discovery process and surface links between corporate entities much more efficiently.
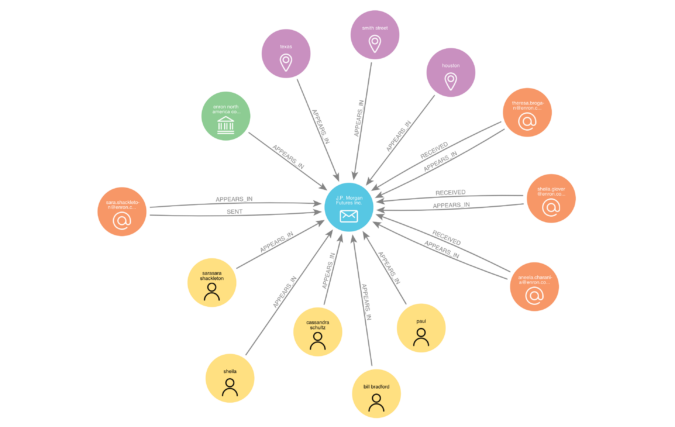
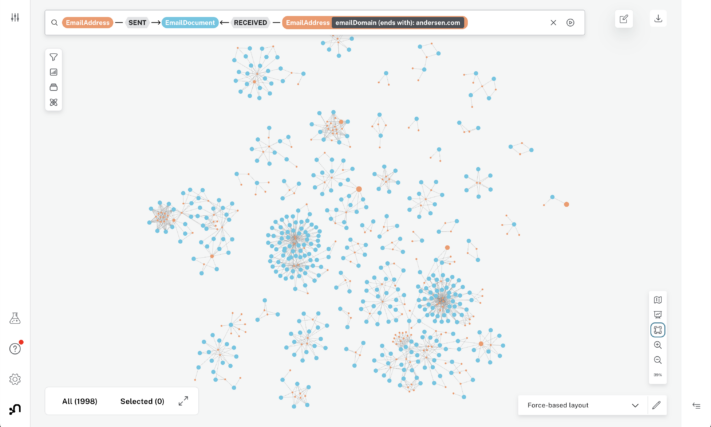
For example, the graphs created with the plug-in are particularly well suited for investigations based on email conversations. Datashare can extract email sender and recipient information consistently and with high precision, producing a highly trustable graph where relationships between senders and recipients can be mapped, as show in the image below:
To showcase how Datashare and Neo4j can be used together on email conversations, ICIJ updated the Datashare Demo with a new project: the Enron email corpus.
The dataset, which is free to access and use for research purposes, consists of about 500,000 emails sent by Enron’s employees before the company’s collapse in 2001.
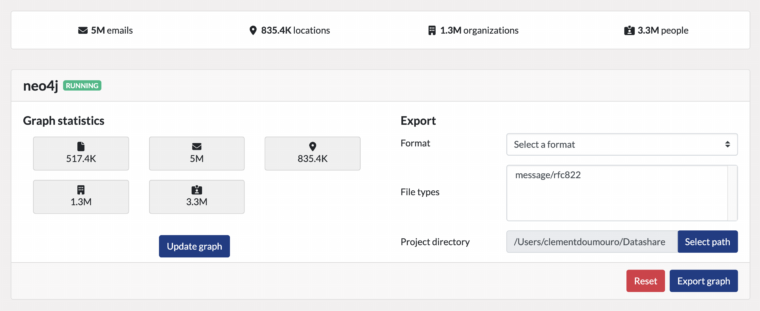
After the Neo4j plug-in was installed with Datashare, an Enron graph was created and a new graph widget appeared on the Enron project page, making it possible to access graph statistics and export the graph if necessary:
After creating the graph, analysts can leverage advanced exploration tools such Neo4j Bloom or Linkurious, as well as simpler visualization software like Gephi, to dive into the data.
The following videos showcase how to use Bloom together with Neo4j Graph Data Science to explore the Enron data.
The first portion steers users through the plug-in set-up and graph creation:
The second part of the tutorial explains how to analyze the graph data to surface valuable insights from Datashare:
In the tutorial, centrality algorithms are used to identify employees centralizing information at Enron:
Timelines are created to dynamically visualize exchanges between different actors over time: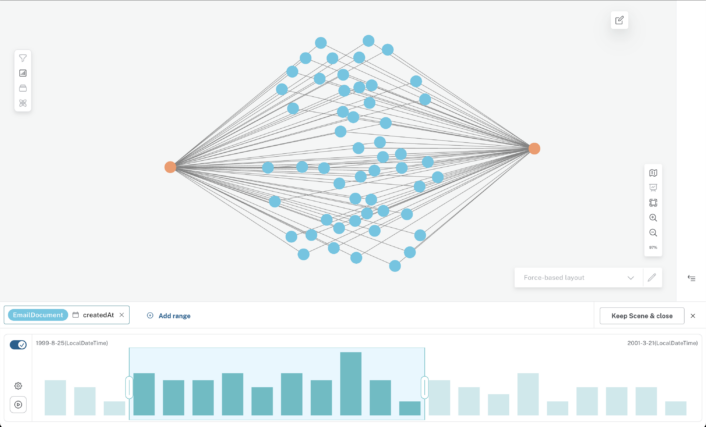
Bloom’s Pattern Search is used to isolate exchanges between Enron employees and their auditors:
Neo4j offers many more powerful data analysis features, such as using the Cypher query language to reveal complex links between entities, clustering similar entities based on connections, or compiling a wide range of statistics from the graph data.
For more information on the plug-in installation and usage, see Datashare’s documentation dedicated section.