ICIJ has hundreds of members across the world. Typically, these journalists are outstanding in their countries and have won many national and global awards. Our monthly series, Meet the Investigators, highlights the work of these tireless journalists.
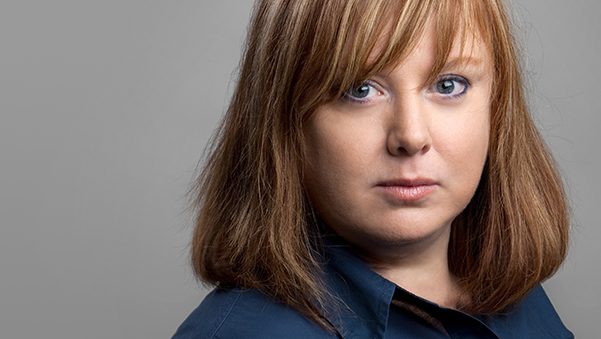
This month, we speak to Helena Bengtsson, the data editor at Sveriges Television, Sweden’s national broadcaster. Previously, she worked on The Guardian’s all-female data team, on top of crunching numbers for both the Panama Papers and Paradise Papers investigations. Follow her on Twitter here.
You didn’t begin your career in journalism like many investigators do. In the early 90s, you were a software developer for some pretty niche industries. What were you tasked with?
My first job as a developer, I programmed using Pascal [an early programming language launched in 1970] and the second, longer one, where we did all the crazy stuff, I used BASIC. This was just as Windows was launched. IBM at that time actually launched an alternative to Windows called OS2, so they kind of tried to beat Microsoft. My last job before going to university, I worked using that operating system.
I was building programs for an airline company, so I made a program tracking work hours for pilots and flight attendants because they can’t fly after a certain amount of landings and time in the air. They need to rest, and every airline keeps track of that, so they don’t end up booking too many hotel nights, You want to optimize the time they stay at home, so you don’t have to pay extra.
That’s what I like about data journalism, you can look for yourself. You don’t have to rely on a press release or a researcher or an organization.
Did that give you a headstart when it came to data journalism?
Well, I learned I wasn’t afraid of taking on a new programming tool, and I knew how programming worked. I don’t program a lot at my work now, but it helped when I got into journalism school and we were introduced to the concept of data journalism in 1994. It was very early, but I wasn’t afraid of it…because I know how computers and spreadsheets work. I think I had seen a spreadsheet back then, on Lotus 1-2-3, but we didn’t have email yet.
In 1996 and 1997, my internship bosses at SVT sent me to a NICAR boot camp at Columbia University. Ever since then I’ve had this unique knowledge. I saw that my fellow interns were struggling more, because they were sharing ground with established reporters, but there wasn’t anybody doing what I was doing.
In one way, I was that strange girl in the corner of the room using Excel, but nobody really understood what I was doing. On the other hand, nobody was really competing with me either. And credit to my bosses, they left me alone.
What tools do you use now at SVT?
I still spend 80 percent of my time in Excel, because I think it’s the best tool to get an overview of what you’re looking at. I don’t do data visualizations at all. I look for stories.
When I scrape, I’m very old-fashioned, and, people are going to laugh at this, but I use a very old fashioned tool called PERL, which has been abandoned now because everyone uses Python. I use PERL for scraping, and I use Postgres [an open source relational database management system] to store data if it’s a large database. We have a more visual journalism data team, so we actually have two data teams right now, and if you want to work on the data at the same time you put it in an SQL database [a collection of data structured in tables, such as PostgreSQL or MySQL].
I will never learn a tool for the sake of it. I will only learn a tool when I need it for a project. Until recently we had a really hard time getting maps in Sweden, so up to two or three years ago, I’d just use google maps or tableau to do simple data visualizations that help me see a pattern.
So not too complex. How do you synthesize data stories?
You usually have a journalistic idea where you go find data for it, but you should always be very open, because sometimes that idea shows you something completely different.
When you have those big data sets I almost look at them as if I were interviewing a person. You get it and look at it like, what do we have here? Can we group things? How much data is there? What is it about?
Sometimes I just scroll through data just to see what pops out at me. Then I start asking questions through the data. It’s like when you meet an interesting person, and you might ask them a question, then you listen to the answer, and you ask the next question. It’s very seldom you have a dataset out of the blue. You most likely have some sort of journalistic idea.


Your higher education stories for the Guardian caused quite a stir in the UK. You’ve also done prominent education analyses at SVT. What draws you to this topic?
I think it has something to do with the access to data. I think there’s a lot of data available for education, and it’s a subject matter that is very close to people.
Everyone has gone to school, a lot of people have kids in school or work in a school, so it’s a subject matter that lies close to people, and there’s a lot of great data there. Also, in almost every country, the school system isn’t fair. I haven’t yet found a country in which the school system is fair.
My uncle went to university, but other than him, I’m the first generation in my family to go to university, and for me, it’s really important that everyone who wants to level out those differences in school should be able to. That’s what school is about, but it’s also very clear when you look at data that it’s not.
You have schools that can’t take care of those people, that can’t raise the levels of those students, and that’s something I, over time doing these stories, have got engaged in and find to be really important.
Where do you feel your work fits into the current information landscape when many distrust the media?
That’s what I like about data journalism. You can look for yourself. You don’t have to rely on a press release or a researcher or an organization that made a report. You can actually look for yourself, you can decide your own angle, or several angles if you want to do that, and you can decide your own agenda and what you want to do with that.
You can also break myths that go around. Many people are quick to believe what we call anecdotal evidence, which is not evidence at all.
Many years ago in Sweden, there was a reporter who wanted to prove there was a suburb that was very segregated. She said, there are only people with an immigrant background living in a valley and, on the other side, on a hill, only people who were born in Sweden and whose parents were born in Sweden. She called it the Swedish Hill and the Immigrant Valley.
I pulled the data on that because we have good geographical data in Sweden. You can go down to a block level in Stockholm. I saw the split was more 49 percent to 51 percent. So I said to her, that’s not true. It may look like that, but just because you’ve got black hair doesn’t necessarily mean you have an immigrant background.
You can’t really go out and look at people to make that judgment, you have to look at what the data says. She was really angry at me because that was her feeling. But I said we can’t talk about this like it’s a fact, because it’s not. Even though everyone says so, it doesn’t mean that it’s true.
That’s what I love about data journalism — you can go in and both break myths but also find out if it is true. You can have a feeling that the Home Counties [Editor’s Note: The Home Counties are the counties surrounding Greater London — typically populated by the upper-middle-class] or rich privileged white kids are overrepresented at the top universities in the UK, but it’s better if you can show them the numbers, because if you don’t, you can’t do anything about it.
What issues are currently piquing your interest?
I want to explore the different conditions people have, not just kids but also adults. Recently, I was taken aback because, not only our conservative party but also the social democrats, which has always been a party from the left, were using very harsh words when it came to the asylum seekers in Sweden.
I was astounded. I’d been in the UK for three years, and I followed the news but you can’t follow everything, so I was really astounded when I got back. I think one of the things that we are forgetting, and this might sound old-fashioned, is that people come from different circumstances, that could be a lack of money, or language or culture. Sweden is a very equal place. We pay a lot of taxes, because you shouldn’t earn that much money and because schools are free, roads are free, all those kinds of things.
I think we are getting more, we call it a two-thirds society, where one third has everything and two-thirds have very little, and I find that very interesting. I’d like to look at that more, at demographic data.
One of the things I’ve thought about, I come from a small town, rural, I grew up on a farm out in the middle of nowhere, with a very small high school, and I’ve wondered, would I be able to do what I’ve done if I were brought up now? Would my teachers have encouraged me to do things? Is there a difference now? I think there is. It’s much harder today than it was when I was growing up to even out the different circumstances that we have, which I think is one of the things society should do.
So, that’s a bit old-fashioned, but that’s a story I want to look into once we get out of the elections.
Anything on the technical side? In an interview with GIJN, you mentioned unstructured data (such as text or multimedia presentations that aren’t organized in a pre-defined data model such as a database or a spreadsheet) as the next frontier. What are you up to?
I would like to be better at getting data out of free text, to use scraping and programming to find patterns. For instance, court documents are just stored as PDFs in Sweden. What kind of stories could we do if we had access to a large quantity of those? Are there differences in judging or sentencing? Also working with the documents of the Panama and Paradise projects has made me think a lot about unstructured data and what could be made if we had more knowledge in processing text. But before anything else, I have to get through the Swedish election in September.